Island County gets advance look at future sea levels
Published 4:49 pm Tuesday, September 20, 2016
By Chris Winters, cwinters@heraldnet.com
Island County is getting a leg up in planning for the likelihood of rising sea levels.Washington Sea Grant, an outreach arm of the University of Washington’s College of the Environment, has put together a study to estimate that amount over the next century as it applies to the waters around Whidbey and Camano islands.
It is notoriously difficult to make predictions involving changes to the climate of any sort, given the number of variables involved, ranging from the rate of glacial melting to public policies on pollution control.
But Sea Grant researcher Ian Miller has taken a stab at it by combining historical data and previously published research into a new way of looking at the problem.And the end result is a number that Island County planners can use: 5.9 feet.
That’s the amount the sea level is likely to rise around Whidbey and Camano islands by 2150, the data suggests.
There is a lot of uncertainty in that number still, and it’s based in part on the effects of a once-a-year major storm.
But it’s one number where there used to be none, and therefore it can be incorporated into contingency plans, restoration goals and ultimately into policies governing where and how people live.
“The audience for the document really is planners — it’s a really small audience — and people who are designing and planning restoration projects,” said Miller, a coastal hazard specialist.
That’s because it is the planners who have to figure out what concrete measures to take in order to adapt to changes that are largely outside their control.
There’s still a long way to go before they’ll have something approaching certainty, and the numbers that form the basis of those projections are likely to change as the science becomes more refined.
Coastal resilience
In the meantime, local governments already are working on projects that focus on coastal resilience, the term used to describe how well communities can resist and rebound from extreme weather events and longer-term changes to climate patterns.
Dawn Pucci, a manager in Island County’s salmon recovery program, said the Sea Grant study was used as a way to figure out how to prioritize ecosystem restoration projects.
“We could look at where we wanted to do restoration work, so we could make efficient, wise use of money that comes to us through the salmon recovery program,” Pucci said.
Salmon restoration projects have long been at the forefront of building up coastal resilience because the wild environments the fish prefer also serve as buffers during floods and extreme weather.
In 2015 the Tulalip Tribes restored the 400-acre Qwuloolt Estuary in Marysville to tidal influence, recreating salmon habitat and a natural flood plain on Ebey Slough.
Earlier this summer the tribes also hosted a symposium on sea level rise that directly addressed ways to get scientists from many different agencies to join forces.Pucci’s team steered the focus of the Sea Grant study to five specific locations in Island County.
The report took its sea level rise projections and created rough maps of areas that could experience flooding and would be ideal targets for restoration projects.
Those included areas around Crescent Harbor, Crockett Lake, Moran’s Beach and Useless Bay on Whidbey and around Livingston Bay on Camano Island.
Those areas were selected because there was some restoration potential and also because they are close to important infrastructure such as dikes, wastewater treatment plants or waste storage facilities.
Those locations also were selected because the topography was flat enough to get more accurate and readable maps, Pucci said.
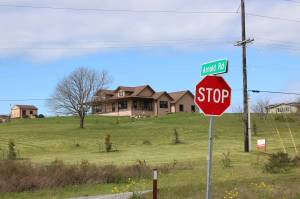
The bluffs around Maple Grove on Camano, by contrast, are so steep that a flooding projection would barely be visible on the map’s scale, Pucci said.
One important caveat to the flooding maps is that they are based primarily on elevation and don’t take into account the effect dikes and tide gates might have to reduce the amount of flooding.Some of the flood-prone areas around Livingston Bay, south of Highway 532, for example, or in the Iverson Spit Preserve, might not flood to the extent that the maps indicate, Pucci said.
“There’s a lot of nuance in the map,” she said.The maps also are likely to change over time, and aren’t refined enough for parcel-by-parcel planning. But they are starting points in trying to crack a notoriously difficult problem.
Science of extremes
The way Miller and his co-authors approached the task was less about field work than it was mining a trove of existing data and repackaging it for a wider audience than just the scientific community.“It’s really about communication,” Miller said.
“We’re not coming up with any new science out there. We’re taking data readily available and presenting it in new ways.
”They started with the baseline standards for carbon emissions in the Intergovernmental Panel on Climate Change’s “Climate Change 2013” report, written by and for scientists and policymakers around the world, but which isn’t really intended to be used in local planning, Miller said.
“Their goal there is to tell the complete picture, as early as possible,” he said.
But Miller realized that climate change effects would be intensely localized, and what people really needed was a way to figure out how their specific communities would be affected, and a way to communicate that to non-scientists.
The IPCC report outlined several different scenarios for carbon emissions, with the worst-case assuming no effort to reduce them.
While the most extreme scenario might not come to be, there is a lot of uncertainty in the IPCC report, in part because scientists’ ability to project effects of global carbon emissions over the course of a century is still imperfect.
The rate at which glaciers in Antarctica and Greenland melt is incredibly difficult to estimate.“It is the biggest source of uncertainty of sea level rise predictions of any sort,” Miller said.
The other big unknown is the rate at which carbon continues to be emitted into the atmosphere. That is dependent on social factors and decisions made by governments, such as the decision last week by the U.S. and China to join the Paris climate accord.
As a result, the IPCC report doesn’t specify which (if any) of the various carbon emissions scenarios is most likely.Planners need a number to work with, however, so Miller used the worst-case scenario as the basis for the Island County report and flood maps. He also provided data for less-drastic scenarios.
“The community has to decide what they’re going to plan for,” he said.The core of the report is a set of tables showing the likelihood of different outcomes. For example, the report says it’s 99.9 percent sure that sea level will rise by a measurable amount in the region by 2050, but there is a 5 percent chance that the rise will be by more than a foot.But then come more details.
Miller also included the natural vertical land movement that is both a factor of plate tectonics and an aftereffect of the retreat of glacial ice sheets. Also in the mix are storm surges, especially when they coincide with high tides.Data for these were obtained from three fixed GPS stations on Whidbey Island and four tide gauges in the surrounding region.
Historical data was used going back as far as possible to determine averages over time.
Risk factors
The entire spectrum of possibilities range from the near-certainty of some sea level rise to the most extreme disaster-movie scenario of seas rising more than 20 feet. That’s an outlier, however, with only a one-tenth of a percent chance of occurring by 2150.
Those probabilities also will likely change over time. There would likely be a succession of high sea/storm surge events leading up to a Hollywood-scale catastrophe. So the most extreme scenario, if it happens, would not come as a surprise, Miller said.
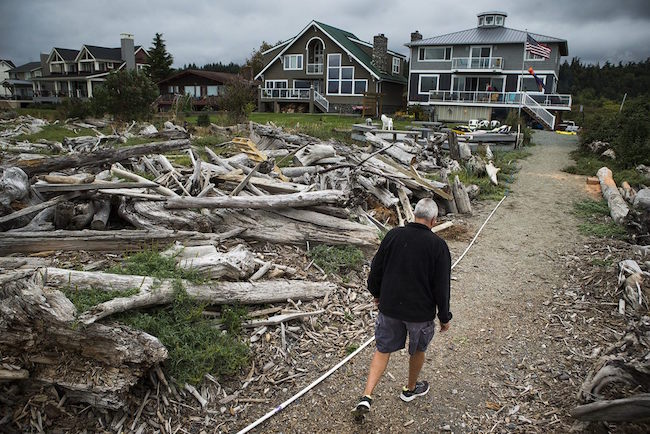
And there is yet one more factor that doesn’t enter into the pilot study: waves. This was reinforced by the March 10 storm which knocked out power, caused flooding and inflicted damage across Whidbey and Camano.
That storm is considered a 100-year-storm in some locations, said Eric Grossman, a research geologist with the U.S. Geological Survey’s Western Fisheries Research Center.
In Skagit Bay, for example, the water rose more than 16 feet above low tide at the height of that storm, he said, and was measured nearly 13 feet above low tide at Snee-Oosh Point, across from the northern tip of Whidbey Island.
“It’s pretty impressive,” Grossman said.“Anecdotally most of the people in that area described that event as far worse than the 2006 event,” he said, referencing a record storm on Feb. 8 of that year.
But “anecdotally” is the key word, because a lot of the damage done in the March 10 storm was by wind-driven waves, some of which broke higher than the roof line of houses along the shore and covered roadways with debris.
There just isn’t any significant historical data on waves to factor into future storm projections.
“If it weren’t windy and there were no wind waves, it wouldn’t have been exciting at all,” Miller said. The storm surge on March 10 was only a moderate foot or foot-and-a-half above sea level, something that his projections already assume is a virtual certainty today.So while the most extreme scenario projects a 20.5 foot rise above normal, that doesn’t include wave effects.
And while the probability of such an event is only one in 1,000, it’s not impossible; and waves can enhance the destructive power of storms even in more-moderate climate scenarios, Miller said.
The good news
While the initial report offers some guidance for county planners, Miller’s study was only the first stage of a much larger project.Washington Sea Grant is the recipient of funding from the National Oceanic and Atmospheric Administration’s Office for Coastal Management to use a similar methodology to do a comprehensive study of the entire Washington coast, including all of Puget Sound.The grant is for about $880,000 and covers three years of research.
Sea Grant and numerous partner agencies, including Island County, plan to prepare models for 3,067 miles of Washington coastline, including 45 coastal cities.
Like the pilot study on Island County, all coastal communities would receive a localized set of projections.“You have different communities with different situations,” said Penny Dalton, the director of Washington Sea Grant.
“The idea is to learn from each other and figure out what works.”Miller said he plans to try and incorporate wave effects into the longer-term study. Wind-driven waves were at least partly responsible for the damage in the March 10 storm, he said.
“We do plan on attempting to make some efforts to develop some total water level projections,” he said. “I anticipate they’re going to be preliminary, because again, you want to base that on data, and we don’t have much.
”That’s good news for Island County, which now has a bit of a head start on the problem and can look forward to a more refined projection in the near future. It’s a concern county leaders are already thinking about.
“They want to make sure there’s good science, there’s good data, and they want Island County residents to be safe,” Pucci said.